Photodiode device model
Measured responsivity, dark current, capacitance and shunt resistance become an equivalent circuit I can simulate.
I design and characterize photodiodes and the circuits that read them, from the first device model to the board, the 3D model and the datasheet. Hire me for one piece or for the whole chain.
Change the reverse bias, temperature, wavelength or load, and the curves and the spec table recalculate from device physics. You can also drag along the dark current, capacitance and responsivity charts to move the operating point.
Device model
| Parameter | Conditions | Value |
|---|---|---|
| Responsivity Rλ = 850 nm, VR = 10.0 V | λ = 850 nm, VR = 10.0 V | 0.641 A/W |
| Quantum efficiency ηλ = 850 nm, VR = 10.0 V | λ = 850 nm, VR = 10.0 V | 93.5 % |
| Dark current IDVR = 10.0 V, T = 25 °C | VR = 10.0 V, T = 25 °C | 148 pA |
| Shunt resistance RshV = ±10 mV, T = 25 °C | V = ±10 mV, T = 25 °C | 1.02 GΩ |
| Junction capacitance CjVR = 10.0 V, f = 1 MHz | VR = 10.0 V, f = 1 MHz | 14.1 pF |
| Depletion width WVR = 10.0 V | VR = 10.0 V | 36.8 µm |
| Bandwidth f−3 dBVR = 10.0 V, RL = 1.00 kΩ, λ = 850 nm | VR = 10.0 V, RL = 1.00 kΩ, λ = 850 nm | 8.09 MHz |
| Rise time, 10 % to 90 % trVR = 10.0 V, RL = 1.00 kΩ, λ = 850 nm | VR = 10.0 V, RL = 1.00 kΩ, λ = 850 nm | 60.7 ns |
| RC limit fRCRL + Rs = 1.01 kΩ | RL + Rs = 1.01 kΩ | 11.2 MHz |
| Transit limit ftrVR = 10.0 V | VR = 10.0 V | 138 MHz |
| Diffusion tail, share of signal pdiffλ = 850 nm, VR = 10.0 V, below 1.25 MHz | λ = 850 nm, VR = 10.0 V, below 1.25 MHz | 13.0 % |
| NEP, diode alone NEPλ = 850 nm, VR = 10.0 V, T = 25 °C | λ = 850 nm, VR = 10.0 V, T = 25 °C | 1.24 × 10⁻¹⁴ W/√Hz |
| NEP with the load NEPRL = 1.00 kΩ at 25 °C | RL = 1.00 kΩ at 25 °C | 6.33 × 10⁻¹² W/√Hz |
| Specific detectivity D*Diode alone | Diode alone | 1.80 × 10¹³ cm·√Hz/W |
| Linear range, load-line limit PmaxRL = 1.00 kΩ, VR = 10.0 V, λ = 850 nm | RL = 1.00 kΩ, VR = 10.0 V, λ = 850 nm | > 10 mW |
| Breakdown voltage VBRIR = 10 µA, 25 °C | IR = 10 µA, 25 °C | 120 V |
| Active area A5.0 mm² active area | 5.0 mm² active area | 5.0 mm² |
I can design the photodiode and its readout electronics together, from the first model to the documents your buyers read. Each step works from the outputs of the one before, so the simulation, the board and the datasheet agree with each other.
Measured responsivity, dark current, capacitance and shunt resistance become an equivalent circuit I can simulate.
Feedback resistor and capacitor, op-amp choice, bias, bandwidth, noise gain and stability, worked out by hand first.
The circuit runs with the device model across bias, temperature and part tolerances.
Every requirement gets a pass or a fail, with the simulation or measurement that backs it.
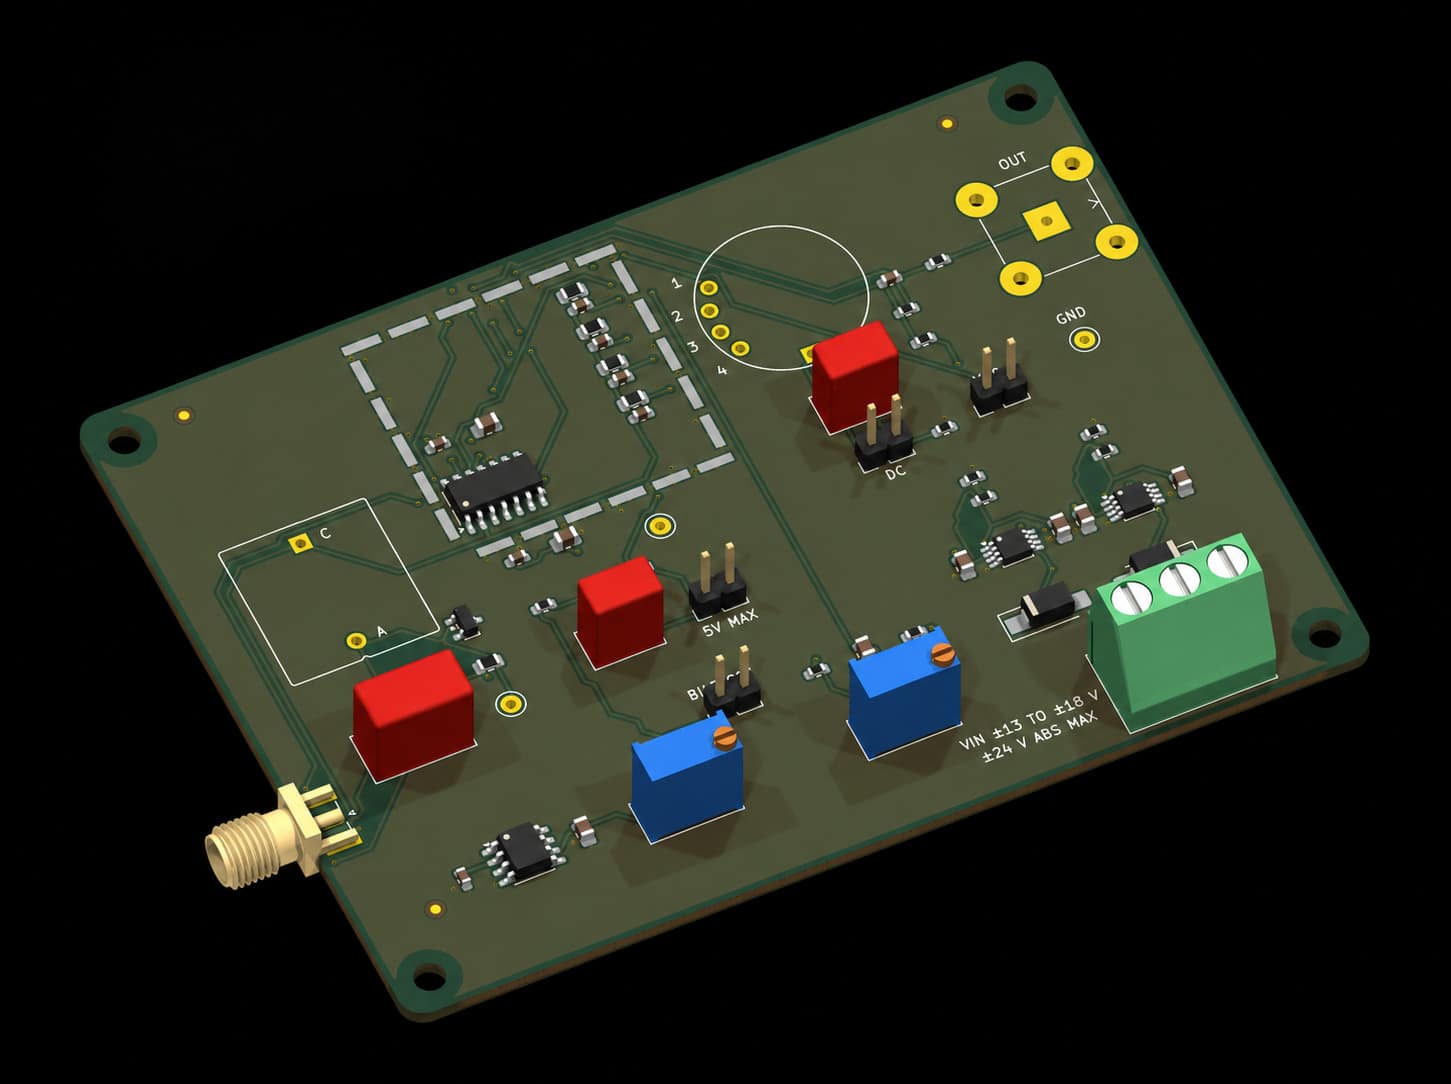
Schematic and board in KiCad, with short input traces and a guard ring around the summing node.
A STEP model of the board and the photodiode package for your mechanical team.
Datasheet curves and an application note built from the same model and test data as the hardware.
Most photodiodes end up driving a transimpedance amplifier. The feedback resistor sets the gain. The diode capacitance and the op amp's gain-bandwidth decide how fast the stage can run and how much feedback capacitance keeps it stable. This panel uses the diode from the live datasheet at its present bias.
Si PIN, 5.0 mm² active area, at VR = 10.0 V, 25 °C and 850 nm: Cj = 14.1 pF, R = 0.641 A/W
Bandwidth estimate
FET-input op amp: 100 MHz gain-bandwidth, 4 nV/√Hz, 3 fA/√Hz, 3 pF input capacitance, ±4.8 V output swing.
A short pulse of light hits the diode from the live datasheet, and the scope shows the voltage across its load resistor. Three things set the edge: the junction capacitance charging through the load, the time carriers take to cross the depletion region, and slow carriers that diffuse in from below it. More bias lowers the capacitance and sharpens the edge, while a bigger load slows it.
Shares the live datasheet's operating point
What sets the edge
The main electrical characteristics, with the textbook relations the live model uses.
R in A/W; wavelength λ in nm.
Responsivity is photocurrent per watt of light. Quantum efficiency η is the share of photons that end up as collected carriers. The photon energy ties the two together, so a perfect silicon diode would give 0.73 A/W at 900 nm. Reflection, a thin dead layer at the surface and light that passes too deep keep real parts below that line.
The current that flows with no light: thermal generation in the depleted volume plus surface leakage. It grows with reverse bias as the depletion region widens, and with temperature. In silicon it typically doubles every 8 °C to 10 °C, so a hot enclosure can raise it more than tenfold.
m ≈ 0.5 for an abrupt junction; ≈ 0.33 for a linearly graded junction.
The depletion region behaves like a parallel-plate capacitor, C = εA/W. Reverse bias widens W, so capacitance falls. In a PIN the curve flattens once the intrinsic layer is fully depleted, which you can see on the InGaAs device above.
The slope resistance of the diode near 0 V, measured at about ±10 mV. It sets the Johnson noise of an unbiased diode and falls as temperature rises, at roughly the rate the dark current grows.
Three limits stack up. The junction capacitance charges through the load and series resistance, carriers take time to cross the depletion width, and carriers made below the depletion region diffuse in slowly and leave a tail. The tail matters most at long wavelengths and low bias, and it breaks the usual single-pole link between rise time and bandwidth.
Noise-equivalent power in W/√Hz.
Noise-equivalent power is the light level that gives a signal equal to the noise in a 1 Hz bandwidth. The diode adds shot noise from its dark current and Johnson noise from its shunt resistance. The load or feedback resistor adds its own Johnson noise, and with a small load that term is usually the largest by far.
Photocurrent follows optical power over many decades. With a resistor load, the output stops being linear as the voltage across the load approaches the reverse bias plus the built-in voltage, so a bigger load buys signal and gives up range. A transimpedance amplifier holds the diode at a fixed voltage and stays linear much further.
The reverse voltage where avalanche multiplication makes the current climb steeply. Datasheets state it at a set reverse current, and the rated maximum bias sits well below it. Some gain creeps in before breakdown, which shows as an upturn at the top of a dark current curve.
Component makers bring me a new part to model and document. OEMs bring me the light level, wavelength and speed they need, and I find a part and design the front end around it.
Yes. Datasheet values and curves come from your measurements, with the test conditions on every line. Anything modeled instead of measured is labeled that way.
Yes, and that is when device and front-end trade-offs are cheapest to change. I'm happy to sign an NDA first.
Silicon and InGaAs PIN and PN photodiodes, from the visible to about 1.7 µm, as single elements or in custom shapes.
Yes. I draw the schematic and PCB in KiCad and can hand over a STEP model of the assembly. You keep all the source files.
Tell me about the part and what it has to do. I'll reply with a scope and a fixed price.