EUV and DUV optics: filter, multilayer and coating design
I design and model the thin films that EUV and DUV light passes through or reflects from: free-standing filters, Mo/Si multilayer mirrors, and coatings for 193 nm and 248 nm. I also write the datasheets and application notes your customers read before they buy. Every EUV spectrum on this page is calculated from CXRO reference data.
EUV lithography and high-NA optics
13.5nm
ASML's EUV scanners print chips with 13.5 nm light. A CO₂ laser fires two pulses at each falling tin droplet, and the tin plasma emits the EUV.
0.55NA
High-NA EUV raises the numerical aperture from 0.33 to 0.55, which ASML rates at 8 nm resolution against 13 nm. ASML and imec opened their joint High NA lab in Veldhoven in June 2024.
100+layers
Most materials absorb EUV, so the optics are multilayer mirrors in vacuum, each with over 100 layers. The source also emits deep-UV light and 10.6 µm laser light, which spectral purity filters keep off the mask and wafer.
EUV filter transmission explorer
Pick a metal and a thickness, add a native oxide and a support mesh, and read the transmission at 13.5 nm. Each layer uses its CXRO attenuation length, and the mesh passes only its open area.
38.5% at 13.5 nm for 200 nm Zirconium with 2 nm of ZrO2 on each face on a mesh with 82% open area.
- Transmission at 13.5 nm
- 38.5%
- Metal foil alone
- 49.7%
- Oxide, both faces
- 94.6%
- Mesh open area
- 82%
- Attenuation length in Zr
- 285.9nm
Passes more than 10% from 6.0 to 18.8 nm.
Calculated from CXRO attenuation lengths (Henke et al.), downloaded 2026-10-22. Oxides use bulk densities and sit on both faces of the foil. Interference inside the foil and diffraction from the mesh are left out.
EUV filter design and modeling
A thin metal foil passes a band of EUV and blocks visible and infrared light. I model the foil, its oxide and the mesh that carries it, then set the thickness tolerance against the transmission your part has to meet.
The same model answers the questions that come after the first prototype: how much a few nanometers of oxide or carbon costs, how much light a pinhole lets through, and how hot the foil runs under the source.
- Free-standing and supported foils of Zr, Al, Nb, Mo, Si and Be, alone or in bilayers
- Mesh and frame support: open area, wire pitch and the transmission they cost
- Spectral purity: out-of-band suppression at DUV, visible and IR wavelengths
- Oxide and carbon layers, thickness tolerance and pinhole leakage
- Thermal load: absorbed power, foil temperature and radiative cooling
Multilayer mirrors and coatings
A Mo/Si mirror reflects 13.5 nm light by interference across dozens of bilayers. I choose the period, the Mo fraction Γ and the capping layer for your angle and bandwidth, then estimate how interface roughness and interdiffusion lower the peak.
- Period d and Γ for the wavelength and the angle of incidence
- Angle and bandwidth trade-offs for one angle or a range of angles
- Ru and other capping layers, and what they cost in peak reflectance
- Interface roughness with Névot–Croce and Debye–Waller models
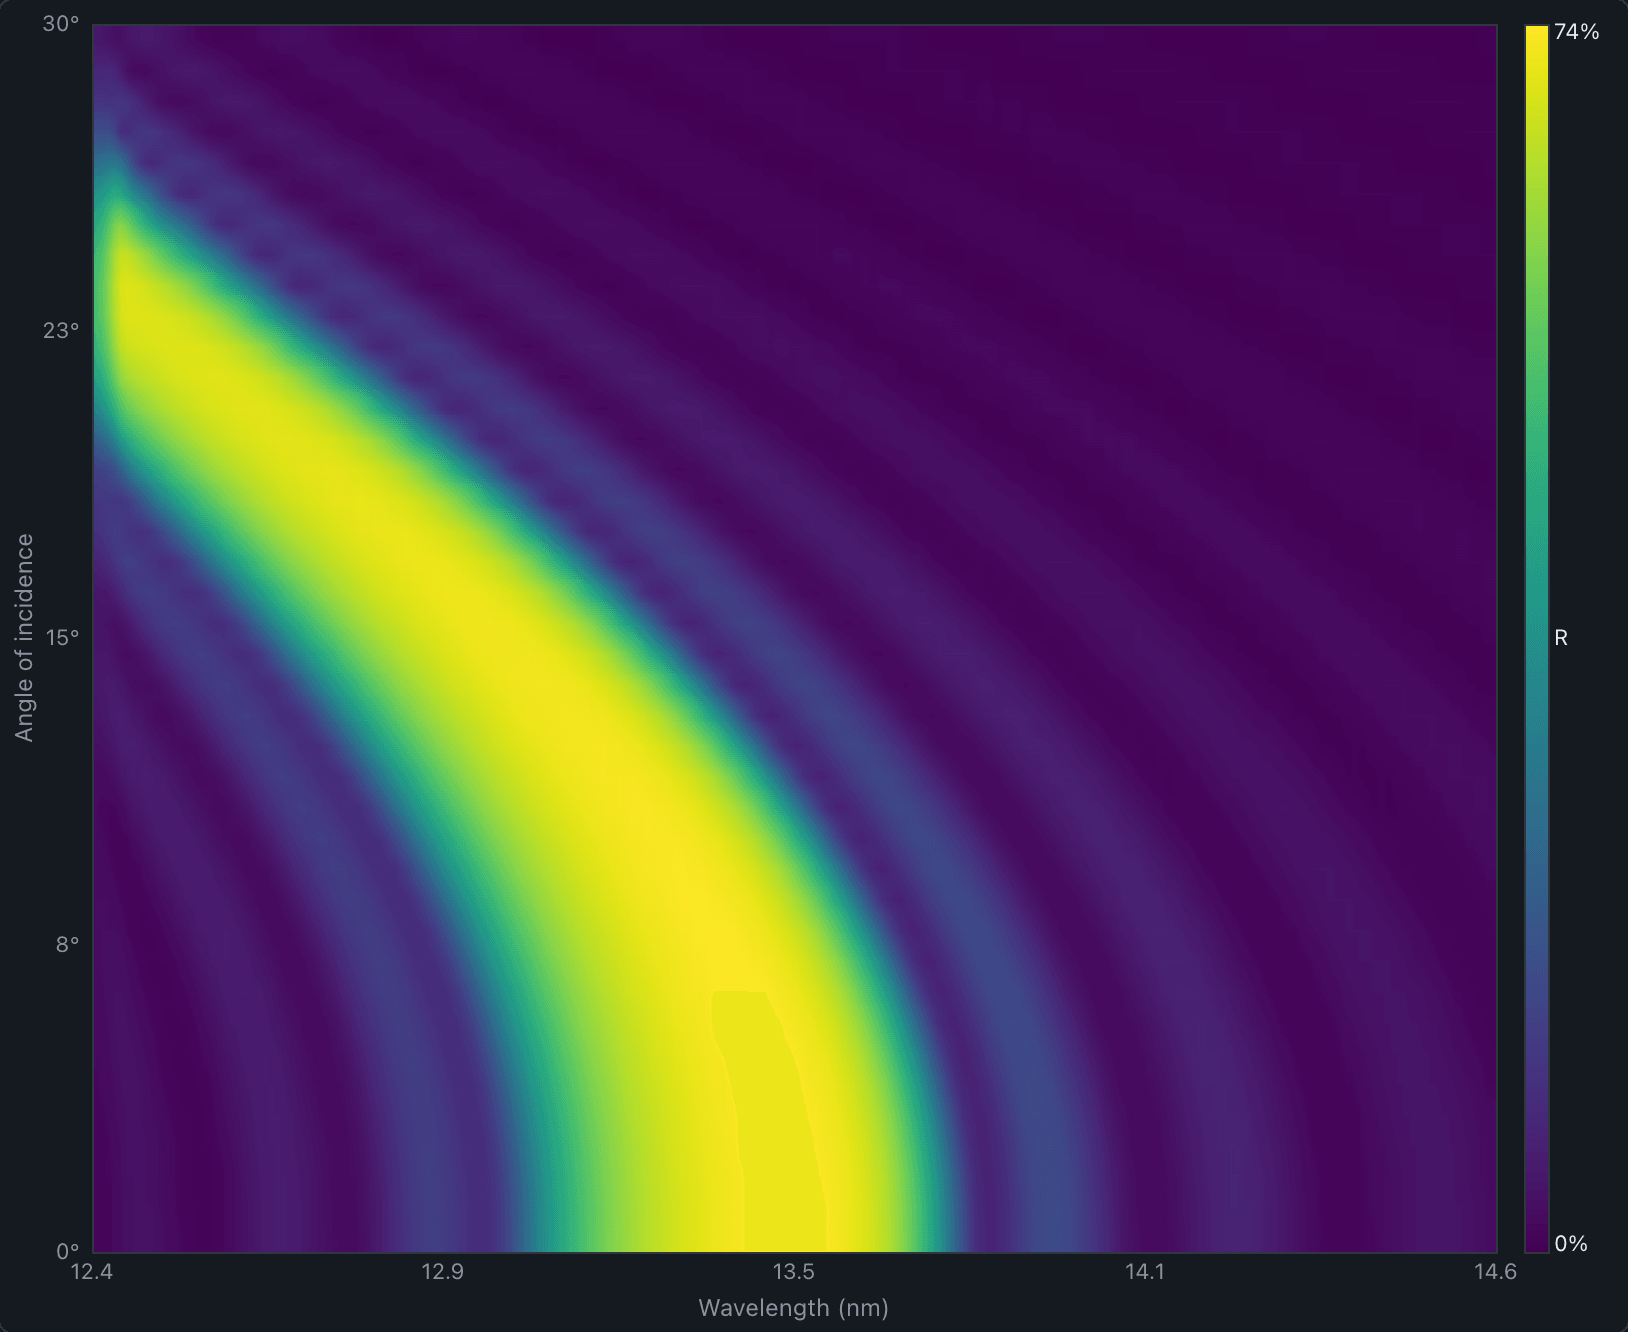
- Reflectance spectra, field profiles and angle maps from EUV Insight
Mo/Si mirror reflectance
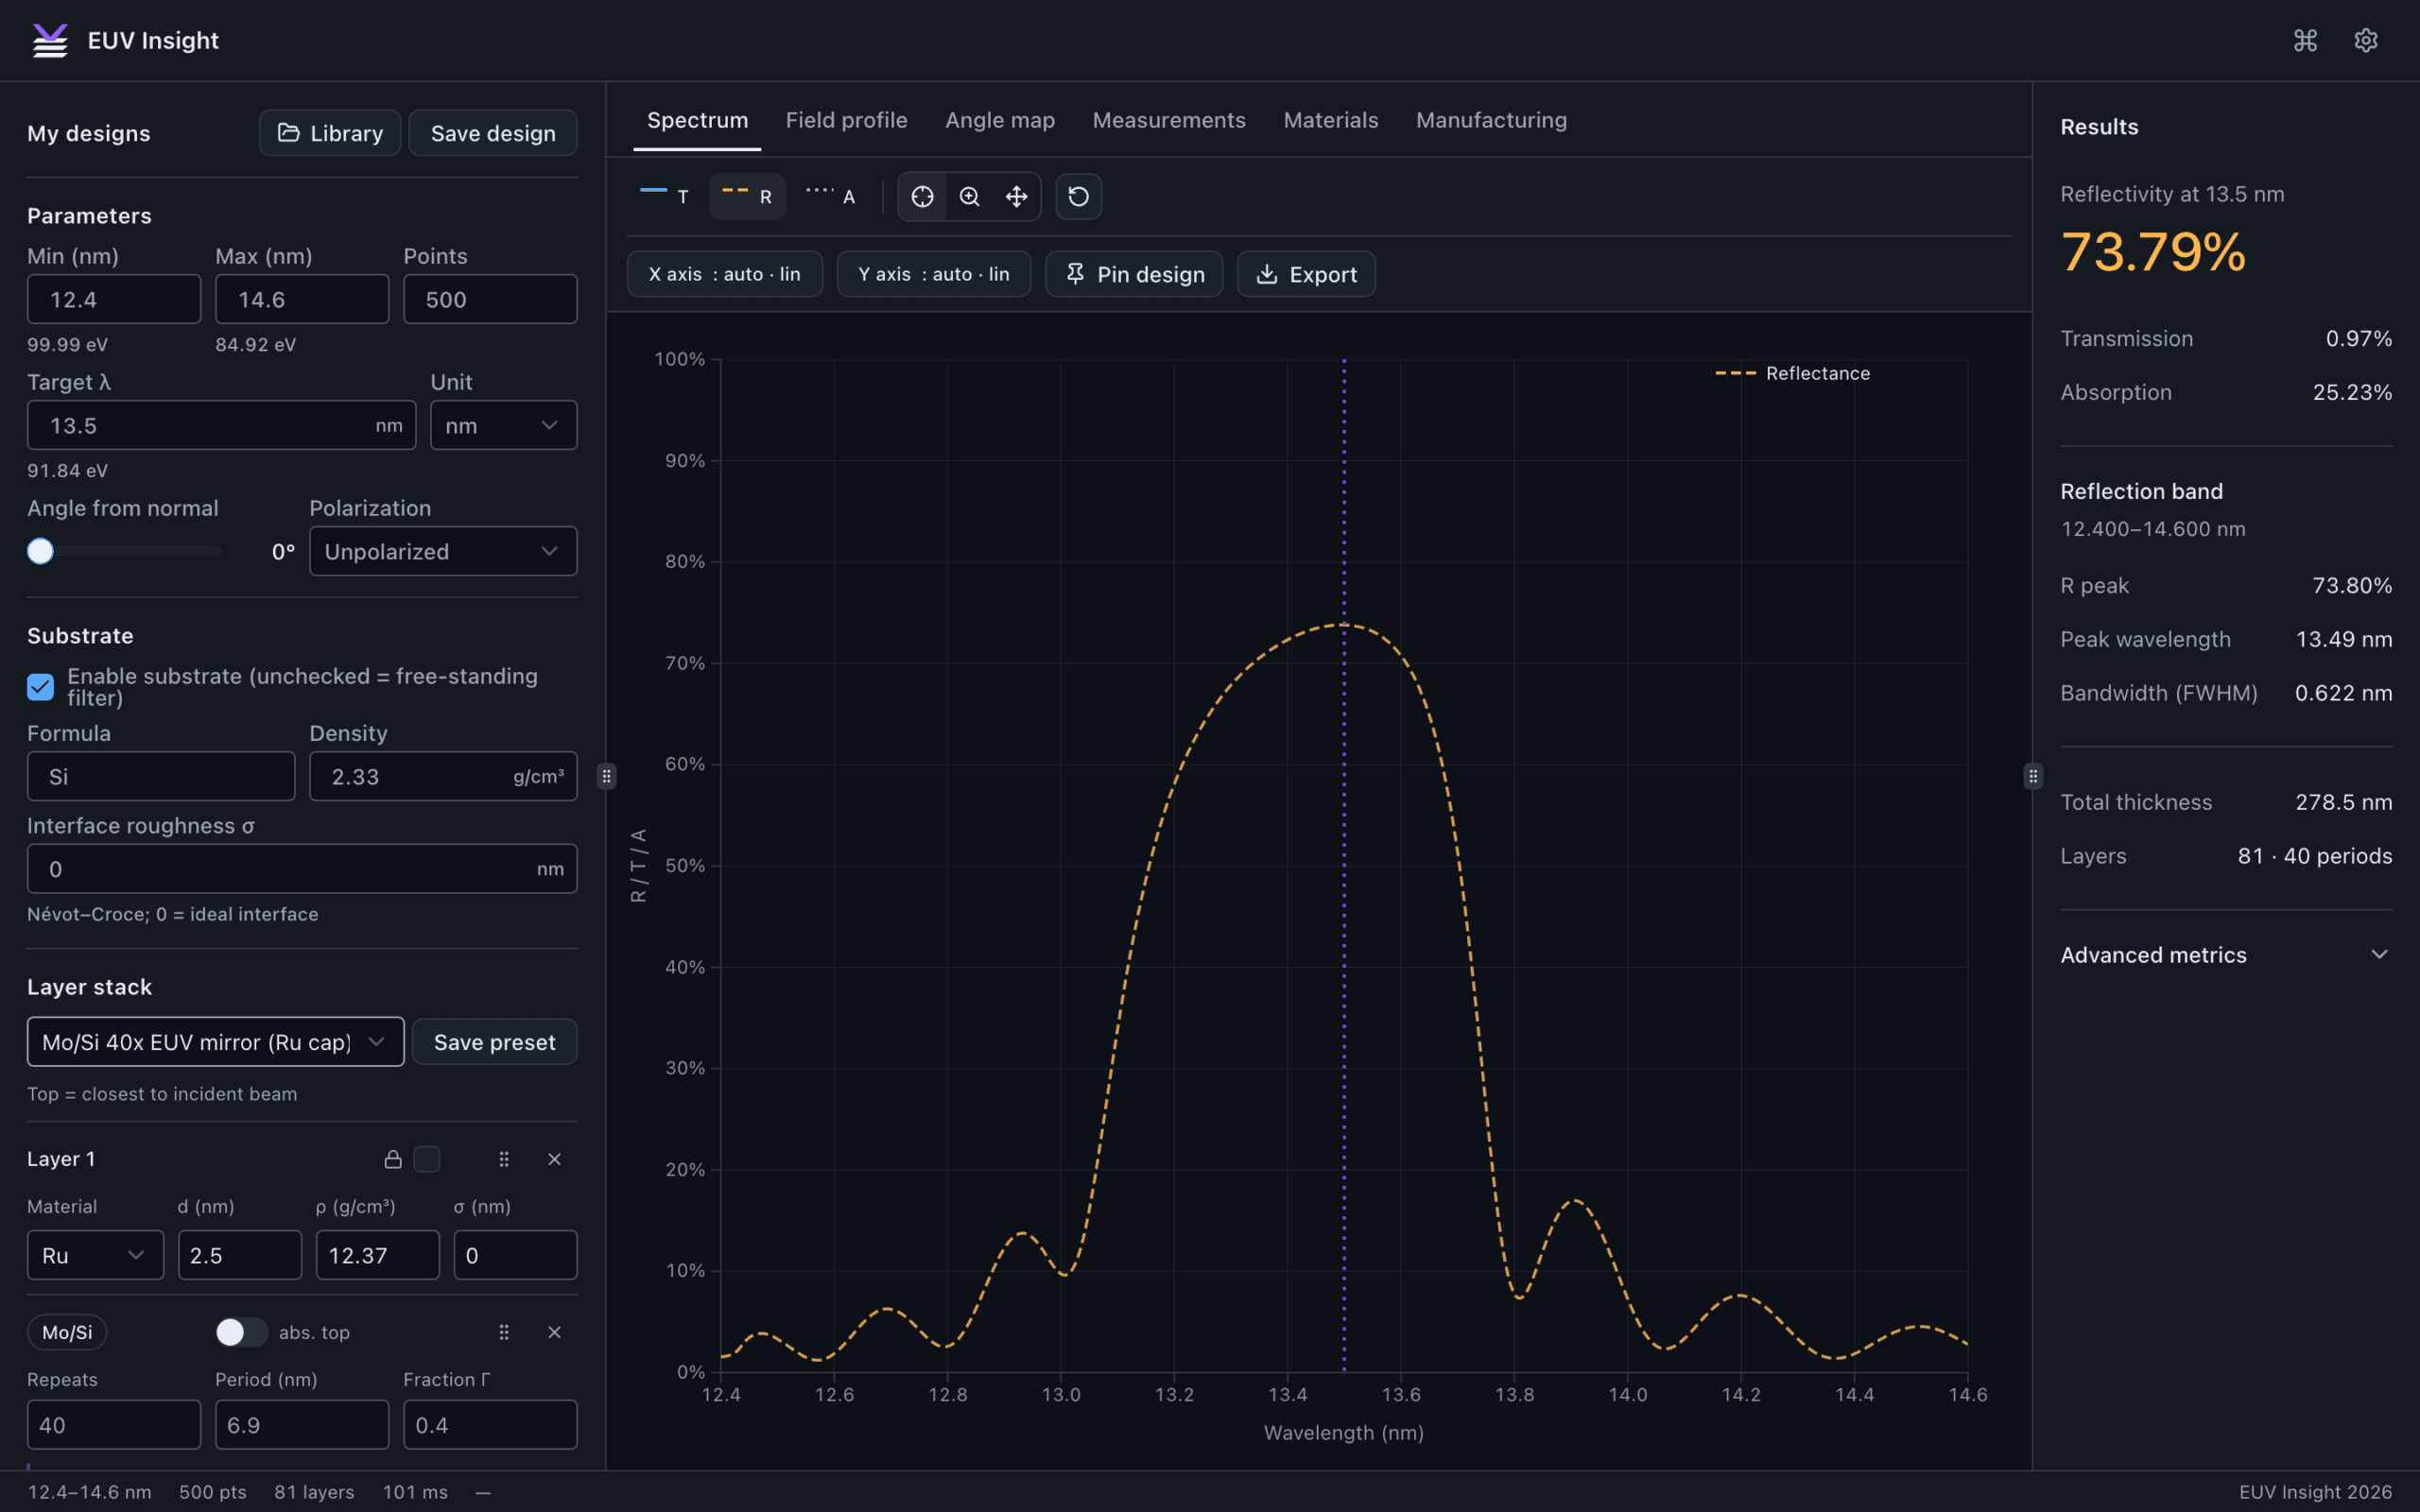
The starting stack is the one in the EUV Insight screenshot below, and both calculations give a 73.8% peak at 13.49 nm. Change the period, Γ, the number of bilayers or the roughness.
Peak reflectance 73.8% at 13.49 nm for 40 Mo/Si bilayers, period 6.90 nm, Γ 0.40, roughness 0.00 nm, Ru cap 2.5 nm.
- Peak reflectance
- 73.8%
- Peak wavelength
- 13.49nm
- Bandwidth (FWHM)
- 0.622nm
- Stack thickness
- 278.5nm
Parratt recursion with Névot–Croce roughness, CXRO δ and β, Ru cap 2.5 nm, Si substrate, normal incidence.
Transmission and reflectivity analysis in EUV Insight
I built EUV Insight, a browser app for EUV thin-film design. On your project I use it to compare materials and thicknesses, run Monte Carlo thickness tolerances, and export spectra and figures for your reports and datasheets.
DUV optics at 193 nm and 248 nm
ArF excimer lasers at 193 nm and KrF lasers at 248 nm are the light sources of DUV lithography. I design the coatings and filters for these lines, specify CaF₂ and fused-silica parts, and plan the durability tests that show a coating survives the pulses.
- Antireflection, high-reflector and bandpass coatings for 193 nm and 248 nm
- CaF₂ and fused-silica windows, lenses and beam-delivery optics
- Filters that pass DUV and block visible light, or the reverse
- Laser durability: fluence limits, damage-test plans and long-term absorption changes
EUV and DUV photodiodes and readout electronics
Dose monitors and beam diagnostics need a photodiode and a front end matched to the source. I design both, from the device model to the readout board, and I model any filter coating on the diode with the same data as the explorer above.
- Responsivity targets at 13.5 nm, 193 nm and 248 nm
- Transimpedance and charge-amplifier front ends for pulsed and continuous sources
- Noise, bandwidth and dynamic range, simulated in SPICE and MATLAB
- Circuit design, KiCad schematics and PCB layout for the readout board
Datasheets, application notes and CAD for EUV and DUV parts
Buyers of filters, mirrors and windows compare transmission curves, test conditions and tolerances before they ask for a quote. I write the datasheets, application notes, selection guides and white papers that put those numbers in front of them, and I build the 3D models and drawings. For readout boards that includes the circuit design and KiCad files.
- Datasheets with test conditions, typical values and limits
- Application notes and white papers with computed figures
- Selection guides that compare materials, thicknesses and coatings
- STEP models, outline drawings, circuit design and KiCad libraries
EUV filter, Zr 200 nm on support mesh
Rev A
| Parameter | Value | Conditions |
|---|---|---|
| Transmission at 13.5 nm | 38.5% | Normal incidence, calculated |
| Filter metal | Zr, 200 nm ± 10 nm | Free-standing |
| Oxide | ZrO₂, 2 nm per face | Modeled, bulk density |
| Support mesh | 82% open area | 363 µm pitch, 35 µm wire |
| Clear aperture | 10 mm diameter | Illustrative |
Transmission from CXRO attenuation lengths.
Common questions
Which filter material should I use at 13.5 nm?
It depends on the band you need to pass and what you need to block. In the CXRO data, Zr and Si both transmit well at 13.5 nm, Si cuts off sharply below its L edge near 12.4 nm, and Al only opens up above about 17 nm. Strength, oxidation and the out-of-band spectrum of your source usually decide between them, and I compare those for your case.
Can you model out-of-band leakage at DUV, visible and IR wavelengths?
Yes. The CXRO tables start at 10 eV, about 124 nm, so for longer wavelengths I use published optical constants for the metal and its oxide in a thin-film model that includes interference. Each curve states which data set it comes from.
Can you work from our measured data?
Yes. Measured transmission or reflectance lets me fit the oxide thickness, the density or the roughness, so the model matches your parts before it predicts anything new. Public product information is enough to start, and I'm happy to sign an NDA before you share more.
What do I get at the end?
A report with the stack, the assumptions and the calculated spectra, plus the calculation files and CSV data, so your engineers can rerun every number.
Discuss an EUV or DUV optics project
Send the wavelength band, the layer stack or material you have in mind, and what the part has to pass or block. I'll reply with how I would model it and a fixed price.